Table of Content
Dividends (ROI)
Reliability
Infrastructure
Vigilance
Engagement
The Scoring Model
Why the Spider Diagram?
Using DRIVE in Practice
The Discipline Behind the Diagram
About the Author
Measuring AI ROI and Prioritizing Initiatives: The DRIVE Framework
A practical portfolio framework for leaders to prioritize AI initiatives beyond ROI—balancing value, risk, and readiness for real-world deployment

Every organization pursuing AI transformation faces the same fundamental question: with a growing backlog of potential AI initiatives, which ones deserve investment today, which should wait, and which should be quietly parked? Most prioritization frameworks answer this with a single dimension — usually expected ROI or business impact. But AI initiatives fail for reasons that have nothing to do with their upside. They fail because the data wasn't ready, because nobody used them, because a regulator flagged them, or because the outputs couldn't be trusted. Measuring AI ROI correctly is part of the answer, but only part.
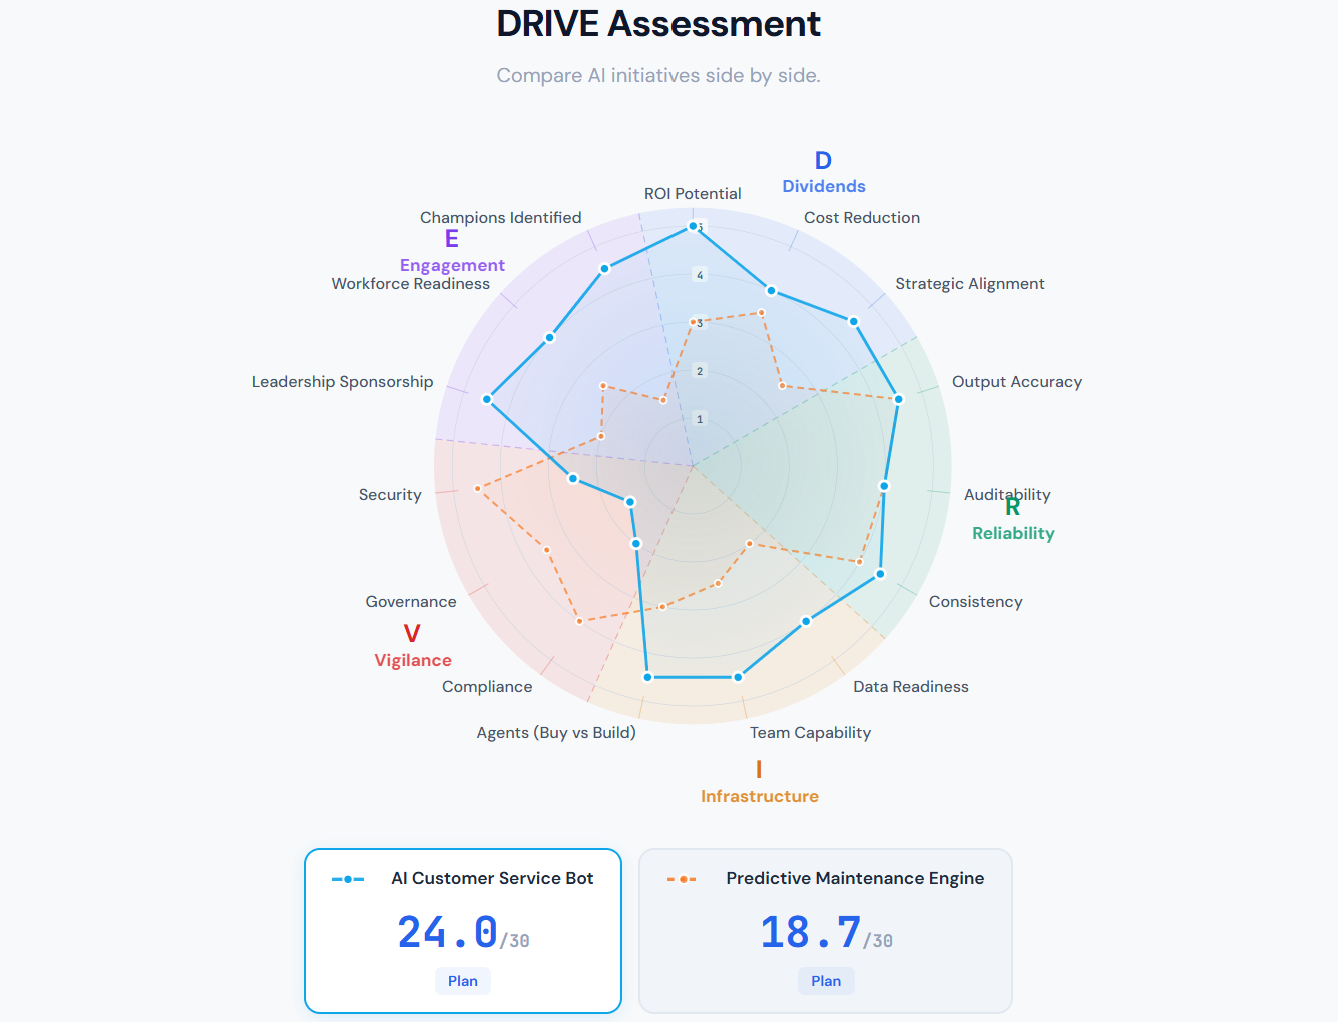
The DRIVE framework addresses this by scoring initiatives across five dimensions that together determine whether an AI project will actually succeed in production: Dividends, Reliability, Infrastructure, Vigilance, and Engagement. Visualized as a spider diagram with three sub-dimensions per axis, DRIVE gives leadership teams a single picture that reveals not just how promising an initiative is, but where it is fragile.
The Five Dimensions
Dividends (ROI)
Dividends is where the ROI question lives — but AI returns rarely show up as a single ROI number, because AI creates value in three structurally different ways. The Dividends dimension therefore asks three questions: does the initiative reduce human effort, improve output quality, or enable work that was previously impossible?
The first is efficiency — the change in human time required to complete a workflow. This is rarely as simple as counting hours saved. An hour of senior reviewer time is not interchangeable with an hour of junior admin time, so efficiency is best measured as a weighted sum: the time change for each role multiplied by that role's weight, where weights reflect compensation, scarcity of expertise, or bottleneck value. An initiative that saves fifty admin hours may matter less than one that saves five hours of a principal engineer whose calendar is the binding constraint on the business.
The second is effectiveness — the change in quality of the workflow's output. A faster bad report is still a bad report. Effectiveness is measured at the workflow level, not the model level: the model may generate acceptable text, but the question is whether the final decision, shipped code, or customer response is more accurate, more complete, more consistent, more compliant, or rated higher by users and experts than before. In many workflows, quality needs to be split into technical correctness, completeness, usability, and compliance, because a single aggregate score can hide the places where AI made things worse.
The third is expansion — the set of tasks, outputs, or decisions that AI makes newly possible. This is the dimension organizations most often overlook, because it is the hardest to measure in advance. It captures personalization at a scale no human team could sustain, real-time analysis on data volumes that used to require overnight batches, 24/7 coverage in languages the business never staffed before, and the ability for non-experts to produce expert-level work. Economists would call this option value or frontier expansion: AI enlarges the set of things the organization can profitably do. Metrics include the number of newly feasible use cases, revenue from AI-enabled offerings that did not exist before, coverage gains in customers or languages served, and reductions in the minimum skill threshold required to complete a task.
Most high-value AI initiatives touch all three. A fraud detection model saves analyst hours (efficiency), catches fraud humans would miss (effectiveness), and enables real-time interdiction that batch processes could not (expansion). Scoring Dividends honestly means asking all three questions rather than collapsing them into a single efficiency-only ROI estimate.
Reliability
Reliability captures whether the system will actually work when deployed. For AI, reliability is not just uptime — it is output accuracy, auditability, and consistency. Can the model's decisions be traced and explained? Does it produce the same answer twice? When it gets something wrong, can we detect and correct it? These are non-negotiable for any AI system embedded in real workflows.
Infrastructure
Infrastructure covers the readiness of data, the capability of the team, and the increasingly consequential question of whether to buy or build AI agents. With capable off-the-shelf agents now available for many use cases, the build-versus-buy decision is often more important than any technical architecture choice. Infrastructure asks: do we have what we need to execute, and have we made the right make-or-buy calls?
Vigilance
Vigilance is the dimension most often underweighted. It combines compliance, governance, and security — the three pillars of responsible AI operation. An initiative with no compliance posture, no governance oversight, and weak security controls is a risk to the business regardless of how much value it might create. Vigilance scores are where ambitious AI programs most often reveal their blind spots.
Engagement
Engagement measures the human side: leadership sponsorship, workforce readiness, and whether champions have been identified within the business units that will use the system. Technology adoption is ultimately a social process. An initiative with no champions is an initiative that will be abandoned the moment it hits friction.
The Scoring Model
Each sub-dimension is scored on a 1–5 scale, producing a dimension average. The composite priority score weights Dividends twice — because ROI is ultimately what leadership cares about most — and sums the rest:
Priority Score = (Dividends × 2) + Reliability + Infrastructure + Vigilance + Engagement
The maximum possible score is 30. Initiatives landing between 24 and 30 are fast-track candidates; 17 to 23 are planning candidates; 10 to 16 warrant a pilot; below 10, they should be parked until conditions change.
Why the Spider Diagram?
A single composite number hides the shape of an initiative's risk. Two projects can both score 18, but one may be strong across the board and the other may have three excellent scores and two catastrophic ones. The spider diagram exposes this shape immediately.
Consider an AI customer service bot that scores close to the fast-track threshold. On paper, it looks nearly ready: strong Dividends from automation of high-volume interactions, solid Reliability, good Infrastructure with a capable team and well-chosen off-the-shelf agent, and enthusiastic Engagement from the contact center. But the spider reveals a deep inward dent on the Vigilance axis — compliance, governance, and security are all weak. The composite score looks great, but the shape tells a different story: this initiative is ready to launch everywhere except where regulators and security teams will stop it cold.
Compare this to a predictive maintenance engine with the same overall score. Its shape bulges outward on Reliability and Vigilance — the engineering and compliance fundamentals are in place — but it is thin on Engagement. The operations team has not bought in. This is a different risk entirely, and it calls for a different intervention: not a compliance sprint, but a change management effort.
Using DRIVE in Practice
The framework works best when applied quarterly across a portfolio of candidate initiatives. Dimension leads — typically a senior leader per axis — own the scoring rubric for their dimension and bring fresh assessments to the steering committee. The conversation shifts from "which project has the biggest ROI?" to "which project is closest to being fast-track ready, and what would it take to get it there?"
That second question is the one DRIVE is built to answer. An initiative scoring 22 with a weak Vigilance score is not parked — it is flagged as "get Vigilance to 4 and this becomes fast-track." That framing turns the prioritization exercise into an investment thesis: we are not choosing winners and losers, we are identifying the most efficient paths to production-ready AI.
The Discipline Behind the Diagram
The real value of DRIVE is not the scores themselves but the discipline of assessing every initiative across all five dimensions before committing resources. Organizations that score initiatives only on Dividends consistently overcommit to projects that collapse under the weight of unaddressed reliability, governance, or adoption gaps. Organizations that add DRIVE to their portfolio review develop a shared language for risk, a clearer picture of where investment is needed to unblock promising work, and a more honest accounting of what AI transformation actually requires.
The spider diagram is just a visualization. The framework behind it is an argument: that AI initiatives succeed or fail on five dimensions, that all five must be assessed honestly, and that the shape of an initiative matters as much as its score.
About the Author
Dr. Rohit Aggarwal is a professor, AI researcher and practitioner. His research focuses on two complementary themes: how AI can augment human decision-making by improving learning, skill development, and productivity, and how humans can augment AI by embedding tacit knowledge and contextual insight to make systems more transparent, explainable, and aligned with human preferences. He has done AI consulting for many startups, SMEs and public listed companies. He has helped many companies integrate AI-based workflow automations across functional units, and developed conversational AI interfaces that enable users to interact with systems through natural dialogue.